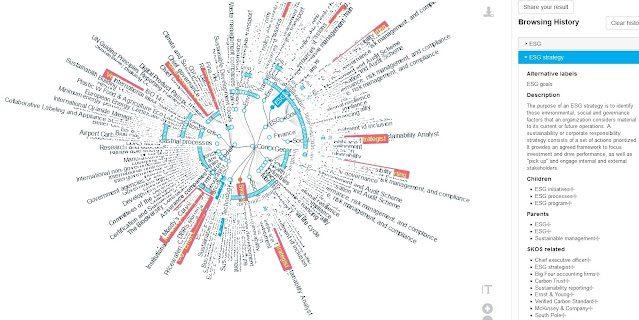
Knowledge graphs have recently emerged as an additional and growing use of taxonomies. A knowledge graph comprises data extracted and stored typically in a graph database with an ontology to semantically link types of data, but usually a knowledge graph also includes a taxonomy, thesaurus, or set of controlled vocabularies to provide consistent labeling. As a result of this combination, people involved in knowledge graphs are taking an interest in taxonomies, and people involved in taxonomies are taking an interest in knowledge graphs.
The traditional and still primary use of taxonomies is to consistently and comprehensively tag and retrieve content, whereas the focus of knowledge graphs is to access and make connections among disparate data. Content tagged and retrieved with taxonomies includes pages in websites, intranets, content management systems; documents in document management systems; and images and video files in digital asset management systems. Knowledge graphs link together data which includes records in databases, customer relationship management systems, product information management systems, and other enterprise systems, and the values in cells in spreadsheets, referenced by their row and column headers. By integrating a taxonomy into a knowledge graph, users can then retrieve both content and data on the same subject together.
What
is a knowledge graph? The first
non-sponsored definition that pops up today with a Google search not
from a vendor is from the the Alan Turning Institute, the U.K. national
institute for data science and
artificial intelligence, which provides the following explanation on its
Knowledge graphs interest group page:
Knowledge graphs (KGs) organise data from multiple sources, capture information about entities of interest in a given domain or task (like people, places or events), and forge connections between them. In data science and AI, knowledge graphs are commonly used to:
- Facilitate access to and integration of data sources;
- Add context and depth to other, more data-driven AI techniques such as machine learning; and
- Serve as bridges between humans and systems, such as generating human-readable explanations, or, on a bigger scale, enabling intelligent systems for scientists and engineers.
From the taxonomy perspective, a knowledge graph is a combination of controlled vocabularies or a taxonomy with the semantic layer of an ontology, which adds custom semantic relations and attributes, plus specific instance data, which is stored in a graph database. A knowledge graph thus extends the use of a taxonomy beyond content to also include data. From the graph data perspective, a knowledge graph is the gathering of disparate data, which has been extracted, transformed, and loaded (ETL) into a graph database, where it is linked with semantic relations provided by an ontology and described by terms in a taxonomy, and it can be queried and analyzed all in one place.
 |
| GraphViews of SWC ESG Knowledge Graph |
I will be giving an updated version of those talks, “Knowledge Graphs for Information Professionals” as a free PoolParty webinar on Thursday, August 17, 11:00 – 12:00 EDT, after which the recording will also be available.